1. What is continuity? What is discontinuity?
Continuity basically means that the graph will be predictable, it will have NO breaks, NO jumps, and NO holes, it can be drawn without lifting your pencil, and lastly, the value (actual height) and the limit (intended height) will be the same. In other words what this means is that the graph will go where you think it will go and nothing will be there to interrupt the graph, so no holes, jumps, etc. For example, the picture below.
(http://www.conservapedia.com/images/2/2f/Br-cont-function.png)
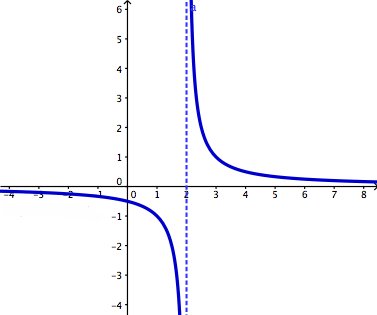
Okay, so now what about a discontinuity? Well a discontinuity will have to be where a function is NOT continuous meaning that it will have breaks, jumps, holes, it will not be predictable, and the limit and the value of the graph will not be the same and equal to each other. We are aware that there are two types of families for the functions that would be removable and non-removable. There is only one removable function and that is the point (hole) discontinuity. The point discontinuity is the only on that has limit as well while the three that we non-removable do not have a limit, or said properly, the limit does not exist at the non-removable discontinuities. These non-removable are jump discontinuity, oscillating behavior, and infinite behavior. Now, the reason that the limit does not exist is due to the fact that in a jump there is a different left and right and the do not meet, in oscillating behavior,...well that thing is just going up and down and it is just confused, and lastly, the infinite behavior means that there is a vertical asymptote which leads to unbounded behavior and also, infinity is not a real number to be dealing with.
This image is an example of a point (hole) discontinuity:
(http://faculty.wlc.edu/buelow/common/imageN20.JPG)
This image is an example of a jump discontinuity:
(http://image.tutorvista.com/content/feed/u364/discontin.GIF)
This image is an example of oscillating behavior:

(http://webpages.charter.net/mwhitneyshhs/calculus/limits/limit-graph8.jpg)
This image is an example of infinite discontinuity:

(http://dj1hlxw0wr920.cloudfront.net/userfiles/wyzfiles/44bad38c-431e-4382-8fe9-86303561b2a0.gif)
2. What is a limit? When does a limit exist? When does a limit not exist? What is the difference between a limit and a value?
A limit is the INTENDED height of a function. A limit exists only when the left side and the right side of the graph meet. Sometimes the circle on the graph is not shaded in and it an open circle, so take a point discontinuity..that's a perfect example because a limit still exist at the point since a limit is only the INTENDED value and that is where the graph is intending to go. Now, at the other three discontinuities the limits do not exist and that is because for some reason the left and right do not match and meet, there is oscillating behavior, and/or there is infinite behavior. The main difference between a limit and a value is that the limit is the INTENDED height of a function, while a value is the ACTUAL height of a function.
3. How do we evaluate limits numerically, graphically, and algebraically?
To evaluate the limit numerically, you would take a t-table of x and y values. We begin by putting the number they give us that it is approaching in the middle of the table and then fill the left and right with the closest numbers that head to the one in the middle. That is actually the most confusing and most difficult because then you can just take your calculator and plug in the numbers to be able to hit trace and basically then just copy down the numbers. For example:

(http://archives.math.utk.edu/ICTCM/VOL10/C006/image2.gif)
To evaluate the limit graphically, we simply put a finger on the left and a finger on the right and follow the graph until your fingers meet ...well...if they meet. Remember they will not always meet because it can be a jump, etc. For example take the graph below and see how if you trace the graph your fingers will not meet because it is a jump and they are different values...this is not like a point of which your fingers would meet.

(http://www.vitutor.com/calculus/limits/images/0_268.gif)
Lastly, to evaluate a limit algebraically, is well you are using equations and we solve. The methods we can use are direct substitution, dividing out/factoring method, and the rationalizing/conjugate method.
Works Cited:
http://www.conservapedia.com/images/2/2f/Br-cont-function.png
http://faculty.wlc.edu/buelow/common/imageN20.JPG
http://image.tutorvista.com/content/feed/u364/discontin.GIF
http://webpages.charter.net/mwhitneyshhs/calculus/limits/limit-graph8.jpg
http://dj1hlxw0wr920.cloudfront.net/userfiles/wyzfiles/44bad38c-431e-4382-8fe9-86303561b2a0.gif
http://archives.math.utk.edu/ICTCM/VOL10/C006/image2.gi
http://www.vitutor.com/calculus/limits/images/0_268.gif

